


This section presents the findings of the study, including: 1) the retention rates of PHCNP graduates in Ontario as of Dec. 2022; 2) other pathways PHCNP graduates had taken; 3) retention rates for PHCNP graduates within the region where they studied as of Dec. 2022; 4) geographic visuals of the distribution of PHCNP graduates from each university and for the province as a whole who were practising as of Dec. 2022; and 5) percentage of PHCNP graduates practising in rural or remote communities as of Dec. 2022.
PHCNP graduate retention in Ontario
The table below shows the retention of PHCNP graduates in Ontario as practising NPs from 1996 through 2022 inclusive, broken down by university and for the province as a whole. Retention is defined as having been registered as a practising NP at the time of the study or having been registered as a practising NP at some time in the past. The aim of this section is to show what percentage of graduates from the consortium program have gone on to contribute to the Ontario health workforce by practising as NPs, versus taking other potential pathways such as leaving the province to work elsewhere or remaining practising as an RN versus an NP Table 1.
Overall, the PHCNP Consortium universities had a consistently high percentage of graduates remaining within the province and practicing as NPs, with a range of 78% to 90.8% for all regions. French program graduates had slightly lower retention rates than English program graduates.
Other pathways for PHCNP graduates
Those who had not practised as an NP in Ontario were identified in one of the following categories: 1. Practised exclusively as a Registered Nurse after graduation; 2. No History of NP or RN Registration in Ontario; and 3. Registered as a Practising NP in Ontario but Working Outside Ontario. These numbers were quite small and are reported in detail in the Appendix section of this article.
Graduate retention within region
There was variation across the province in terms of the percentage of those PHCNP graduates who stayed in the region where they graduated. Figure 4 reflects the percentages of those who continued to practise inside their university region and those who practised in Ontario but outside their home university region. As mentioned above, the regulatory body does not maintain employment locations for graduates who had practised as an NP in the past but were no longer registered as a practising NP. Consequently, we could only track employment or practise locations for NP graduates who were registered as practising NPs as of Dec. 2022.


Percentages of NP Graduates Practicing Inside and Outside Their Home University Region. Source: College of Nurses of Ontario, Google API maps
The green parts of the graph represent the percentage of practicing NP graduates who were working as an NP within the region of their home university as of Dec. 2022. The blue represents those who were working outside their home university region as an NP but still in Ontario. Northern regions, where Lakehead and Laurentian universities are situated, have much smaller populations than in the south and a vaster land mass. They also had higher retention rates within their regions (72% and 66% respectively) compared to most of the southern regions. This shows the importance of the distributed consortium model in educating providers from the North, for the North. The Greater Toronto Area (GTA) has by far the highest number of NP positions and growth in NP positions year over year. The retention rates within region for the GTA universities—York and Toronto Metropolitan—were correspondingly high, at 79% and 78% respectively. As we will see in the next section, the GTA also attracts many graduates from other regions in the province, likely due to the availability of jobs there, highlighting the importance of employment opportunity as a factor in recruitment and retention. University of Windsor, Ontario, in the furthest southwest corner of the province, also had higher in-region retention at 71%. Further study is needed to understand the variability in the retention rates across regions, and the lower in-region retention rates for graduates of McMaster, Queen’s, and Western in particular. The proximity of these regions to the Greater Toronto Area (GTA) and the greater number of NP positions in the GTA are likely factors.
Graduate retention within region—francophone program
The below figure shows the retention within the region of graduation for NPs who took the Francophone version of the PHCNP program offered at Ottawa and Laurentian universities. The green section of the bar shows those who were practicing as NPs within the region where they graduated as of Dec. 2022, and the blue shows the percentage that are practicing elsewhere in Ontario (Fig. 5).

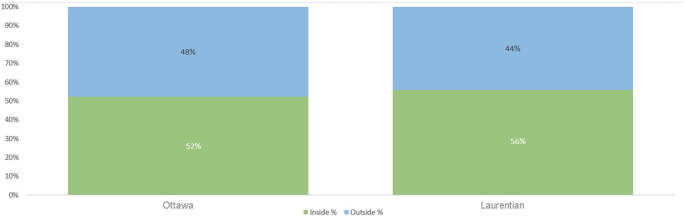
Retention of NP Graduates Within Region from the Francophone PHCNP Program in Ottawa and Laurentian. Source: College of Nurses of Ontario, Google map API
Further insight into these results can be gleaned from the geographic distribution maps and the rurality of the communities where the graduates are practicing, as outlined below.
Geographic distribution of PHCNP graduates
The geographic distribution of practising NP graduates is shown through the interactive google map interface at the link below, which shows the clinical placement boundaries of the university regions, and where the graduates of each region were practising as NPs at the end of 2022. Readers may click on the hyperlink and then click on a particular region on the left side of the map to see where the graduates of that region were practising as of Dec. 2022. Blue dots on the map may represent multiple PHCNP grads, as some agencies employ multiple NPs. Agencies that employ more than one NP are highlighted with yellow circles, showing where there is a higher density of NPs. The maps overall show the range of locations across the province where graduates from each region were practising in Dec. 2022, including the reach of graduates into northern, rural and remote regions (Fig. 6).

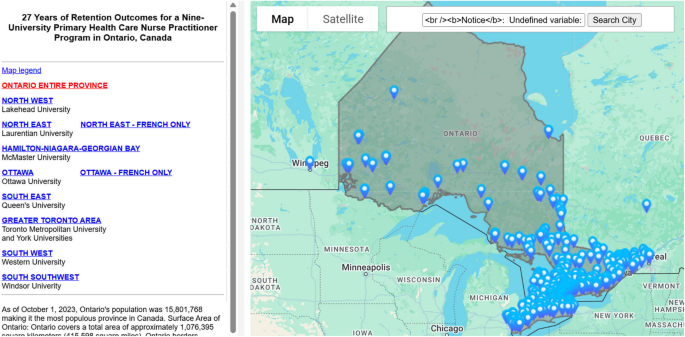
Interactive map showing distribution of practising NP grads for each region. Source: College of Nurses of Ontario and Google map API. https://np-education.ca/documents/retentionsmap/indexgrad.php?univ=help
Percentage of NPs practicing in rural communities
Using the Rurality Index of Ontario tool described above in the Methods section, we calculated percentages of PHCNP graduates who were practicing in rural or remote communities as of Dec. 2022. An RIO of 20 to 30 indicates a moderately rural community in terms of population and health care access. The Ontario government uses an RIO of 40 as the minimum for their incentive programs designed to attract more providers to these locations, indicating significant unmet health care demand in these communities. Characteristics of communities with higher RIOs can be illustrated with the following examples:
-
Alberton Township in northwestern Ontario has the highest possible RIO score of 100. It had a population of 954 people in 2021 and is a four-hour drive from both nearest major centres of Thunder Bay and Winnipeg.
-
Kenora, Ontario, also in the northwest of the province, has an RIO of 80. It had a population of 14,967 people as of 2021 and is a two-and-a-half-hour drive from the nearest major urban centre of Winnipeg, Manitoba.
Below in Table 2 we see the percentages of NP graduates by university who were practising in rural communities with an RIO of at least 20, with further breakdowns into percentages working in communities with higher degrees of rurality.
We can see that in the Northwest and Northeast, where Lakehead and Laurentian Universities are respectively located, the percentages of graduates working in rural or remote communities is the highest at 28.3% and 39.4% respectively, and with larger percentages practising in communities with the highest levels of rurality. This reflects the broader demographics of northern Ontario, with 34.2% of the population in the Northwest living in a rural area (defined as an area having less than 1,000 people), and 30.2% of people in the northeast living in a rural area [35]. These regions are the most sparsely populated areas of Ontario with the biggest land mass. According to an Ontario government report, the Northwest region of Ontario measures an area of about 460,000 square kilometres (slightly smaller than Spain), with a total population of 236,000 people and a population density of 0.6 people per square kilometre. The Northeast region measures about 400,000 square kilometres, with a total population of 565,000 people and a population density of 1.4 people per square kilometre. Combined, the two northern regions represent 80% of the land mass of Ontario [35].
French graduates from the northeast of Ontario had an extremely high rurality rate at 55.6%, with the majority of these in communities categorized in the highest levels of rurality. This reflects the clustering of Franco-Ontarian communities in the rural northeast, such as Hearst with an RIO of 95. These results show the importance of the consortium bilingual education model in developing health services for the Francophone population. As the google maps for the Francophone program graduates demonstrate, some University of Ottawa francophone graduates migrated to the northeast for employment, while some Laurentian graduates located in the Ottawa region. Hence the two Francophone university sites benefit Franco-Ontario communities in providing spillover of graduates into each other’s regions.
In southern Ontario, those universities that had larger rural catchment areas, particularly Ottawa, Queen’s, Western, and Windsor, also had higher numbers of graduates practicing rurally, at 13.5%, 21.2%, 22.5%, and 15.8% respectively. Statistics Canada has identified 13.3% of Ontarians as living in a rural area, albeit with a somewhat different definition of rural than the RIO [36]. The comparison nevertheless provides some context to suggest that PHCNP graduate practise in rural areas bears some reflection of rural demographics in the south. The fact that PHCNP program leaders dedicate some of their government program funding to reimburse students for part of their travel costs to rural clinical placements no doubt supports rural recruitment after graduation.
Limitations
The study is quantitative and descriptive and shows snapshots of NPs who graduated between 1996 and 2022 inclusive, with data current in December 2022. Changes in NP graduate locations or registration status since December 2022 are not captured here. Further, while we were able to identify NPs who had practised in the province but had retired or left practise by the end of 2022 in our statistics about retention of graduates in the province, the provincial nursing registry does not show the employment history of these NPs once they retire or give up their registration. Therefore, it was not possible to map the location(s) where these NPs had practised within Ontario, or how many had practised in rural or remote areas. That mapping data is restricted to NPs who were currently practicing as NPs as of December 2022.
Because the data was based on a snapshot of where all graduates were practising as of Dec. 2022, we do not have a good sense of how graduates may have moved around over time. No differentiation was made between the practice locations of new graduates and those who graduated much earlier and had been in the workforce for many years.
A further limitation is the lack of qualitative studies to capture reasons why graduates may have located where they did. This data would have helped us to better interpret some of the quantitative results.
Additionally, the study does not present a clear cause and effect between the consortium model and retention in region or in province, although it clearly seems associated with such retention. Interpretive data from graduates is needed to have more insight into this and would also enable us to identify other factors affecting where graduates locate and why, and the extent to which they stay in a location. This also highlights how the distributed models of education need to be looked at in relation to other factors affecting recruitment and retention of NPs, such as availability of jobs in each region; workplace climate; compensation that reflects the expanded scope of practise and level of responsibility of NPs; health care agencies that facilitate NPs to practise to their full scope; funding models that enable NPs to set up new practices in needed areas and spend adequate time with their patients to provide holistic care; as well as incentives to practise with rural, remote and underserved populations [37,38,39]. Distributed education cannot by itself address the multiplicity of factors that impact recruitment and retention. From a policy-making perspective, distributed education must be seen as one part of a broader health human resources strategy rather than a solution unto itself.
Lastly, the highly contextual nature of retention rates means that attempts to make comparisons across regions and health science disciplines are fraught. We undertook a comparison with retention statistics from The Northern Ontario School of Medicine University (NOSM) [40], which has campuses in both the northwest and the northeast and a social accountability mandate to educate physicians in the north for the north. Despite the regional alignment of NOSM and PHCNP northern university sites, and the fact that many NOSM graduates specialize as Family Physicians and have a similar scope of practise to NPs, our metric did not align with theirs, as showed in Table 3 below.
We did not have data for our PHCNP graduates on where they had done their undergraduate degrees. We thus created a separate row for the NP graduates in the table above to reflect this. In addition, NOSM was measuring retention of their graduates across the entire north, whereas we measured retention of Laurentian and Lakehead graduates in the more limited regions of the northeast and northwest respectively. In fact, there is some spillover of graduates from one region to the other within the north, which would make NP retention in the north even higher than the 70% and 64% indicated.
Further differences in context of practise compound the challenges in comparing retention rates. For example, physicians have the capacity to set up their own practises in the north, based on their ability to bill the government on a fee for service basis, while NPs tend to be salaried employees and rely on health care agencies and targeted government funding to create positions to which they would apply [41]. This latter can make it more difficult for NPs to take up practise or expand practise opportunities in the north. In addition, the great majority of PHCNP program graduates end up practising in their specialty of primary health care (since the program does not educate them for acute care specialties), while some NOSM medical graduates specialize in other areas that could require location in an urban area [42]. We experienced similar challenges in comparing metrics and context in relation to a 2024 Canadian study of in region retention for graduates of medical schools across Canada [43].
These differences in retention metrics and data availability, on top of differences in working conditions, job availability, payment models, and policy contexts, suggest that attempts to set a broader benchmark for regional health professional retention may be unwise. If education leaders and policymakers wish to increase retention rates in particular regions, they need to take a more focused, contextual approach.
Future areas of study
Qualitative follow-up interviews or focus groups with PHCNP graduates would be an important additional study to identify more clearly the reasons why they located where they did and why they may have stayed or left. This interpretive data would be important to gather for each of the categories of NP grads we identified in the study: 1) those who remained within their home university region and were practising as NPs; 2) those who were registered as a practising NP in Ontario but moved to a different region of the province to work; 3) those who were practising as NPs in rural or remote areas; 4) those who registered as NPs in Ontario but were practising outside Ontario at the time of the study; and 5) those small numbers of graduates who stayed registered and practising as RNs rather than as NPs. Such qualitative analysis is also important to interpret the results of this study for graduates of the French version of the PHCNP program, who had slightly lower retention rates in some respects than for program graduates as a whole.
Qualitative data could also help us gain insight into the variability of in-region retention rates across the different university regions, and differences between French and English program graduates. As outlined above in the limitations section, this interpretive data is needed to help identify which other factors, besides education, need to be targeted by policymakers.
To track the movement of graduates over the course of their career, a cohort study that looks at where graduates practised five years out from graduation, ten years, and so on, combined with interpretive information, could deepen our understanding of graduate trajectories and the factors important in retention.
A further area of study would be to assess how many PHCNP graduates are working with Indigenous communities and vulnerable urban populations. We know anecdotally that NPs in Ontario are important in providing services to these populations; a focused study to track this would be useful to better understand the contributions of NPs and the recruitment and retention factors related to serving these populations.
link