Annual versus less frequent mammographic surveillance in people with breast cancer aged 50 years and older in the UK (Mammo-50): cost-effectiveness and budget impact analysis

Full details of the Mammo-50 trial (ISRCTN48534559) are published elsewhere [5]; however, key cohort details are summarised below for context.
Women aged 50 years or older at the time of initial diagnosis with either invasive breast cancer or DCIS were eligible, on the condition that they had received curative surgery and had no evidence of recurrence for 3 years following treatment [5]. Confirmation of no recurrence was required via mammography at year three [5], and participants were randomised between 36 and 44 months after initial therapeutic surgery [5]. There was no upper age limit specified in the eligibility criteria—inclusion of older participants was at the discretion of clinicians and patients, with the oldest participant aged 91 and the median age at randomisation 66 years [5]. Individuals were excluded if they had bilateral breast cancer (including bilateral DCIS), known BRCA or other high-risk genetic mutations, classical lobular carcinoma in situ, a prior diagnosis of breast malignancy, or a previous non-breast malignancy unless treated surgically with no recurrence for at least 10 years [5]. Individuals with a history of basal cell carcinoma of the skin or cervical intraepithelial neoplasia were not excluded [5].
Two economic evaluations were performed as part of the trial: (a) a within-trial analysis assessing the cost-effectiveness of annual mammography compared to less frequent surveillance over a 5-year period post-randomisation, using trial data linked with HES data [6], and (b) a budget impact analysis estimating NHS savings from reduced-frequency surveillance mammography.
More detail is provided in Supplementary Information file 1.
Resource use data collection and costings
Mammograms
All surveillance mammograms were recorded via trial case report forms (CRFs). Participants were invited for mammograms based on their trial arm and, in the less frequent mammography arm, surgery type: 2-yearly (bilateral) for those after conservation surgery, and 3-yearly (contralateral) after a mastectomy. Participants could request a mammogram at any point during the trial, with reasons recorded.
Data collection timepoints were based on when scheduled mammograms occurred, so timepoint dates varied by participant depending on recruitment and mammogram timing, rather than following fixed calendar dates.
Hospital Episodes Statistics data
Due to the trial design, health-related quality of life and resource use data were collected only at mammogram visits, creating data availability imbalances between arms. To ensure we had robust hospital resource use data for all participants, we obtained HES data (Admitted Patient Care, Outpatient Care, and Critical Care) for each participant for a period of 5 years from their date of entry into the trial (2014–2023). These data captured all hospital activity, not limited to breast cancer-related care. Randomisation was expected to balance comorbidities and unrelated healthcare use across arms. As the last patient was randomised in September 2018, follow-up extends to 2023. Final timepoint cost data may be incomplete for later recruits due to data collection timing.
Other resource use
Participants completed a questionnaire at each surveillance mammogram, covering community-based health and social care use, prescribed and non-prescribed medications for breast cancer symptoms and side-effects, private or self-funded treatment, and other health-related expenses. Participants were also asked to provide details of time off work (for themselves or carers), incapacity benefits, travel and parking related to health appointments.
Health-related quality of life
The questionnaire also included the EQ-5D-5L to capture health-related quality of life. UK utility values were derived by mapping the 5 L descriptive system data onto the 3 L value set—in line with the National Institute for Health Care Excellence (NICE) recommendations [7].
Multiple imputation
Multiple imputation was to address the missing patient questionnaire data and the missing HES data at final timepoint, using the ‘mice’ [8] and ‘miceadds’ [9] packages in R (version 2024-06-14, The R Foundation for Statistical Computing, Vienna, Austria). Imputation was conducted separately by trial arm [10]. Given the longitudinal nature of the dataset, a hierarchical imputation model accounted for within- and between-patient variability. Twenty-five imputation datasets were generated, with up to 20 iterations each. Observed healthcare costs (e.g. hospital costs, prescribed medication costs) and EQ-5D index scores were included as predictors for missing healthcare costs and societal costs (e.g. other expenses, parking costs) to maintain consistency and comparability across analysis perspectives. Societal costs were not used to predict healthcare costs or EQ-5D index due to low correlations. Logarithmic transformations were applied to skewed cost variables. The trial stratification variables (e.g., age, type of disease, surgery type, hormone therapy at randomisation and ER status) and recurrence status at each timepoint were also included as predictors Diagnostic checks assessed validity.
ChatGPT was used to debug coding errors and warnings in R. After using this tool, PC reviewed and edited the imputation model as needed.
Within-trial cost-effectiveness analysis
The base-case cost-effectiveness analysis adopted an NHS and Personal Social Services perspective, including: (i) hospital costs; (ii) costs of surveillance mammograms; (iii) community-based health and social care costs; and (iv) prescribed medications costs. Only data from timepoints four to eight were included to align with the HES 5-year follow-up.
Resource use was valued using 2023 unit costs from national sources (i.e. NHS Reference Costs [11], British National Formulary [12], Drugs and pharmaceutical electronic market information tool (eMIT) [13], and Personal Social Services Research Unit [PSSRU] unit costs [14]). Healthcare costs were inflated to 2023/24 using the NHS Cost Inflation Index [14,15,16], whereas non-healthcare expenses (e.g. private and self-funded treatment expenses, parking costs) were using the Consumer Price Inflation rates from the Office for National Statistics (ONS) [17]. Summary of the unit costs is provided in Supplementary Information file 2.
Due to uncertainty around the surveillance mammogram unit cost, the closest unit cost available (following discussion with NHS Digital) was that of a screening mammogram (NHS Cost Collection, £115.25 [11]). Consultations with participating trusts confirmed that surveillance mammograms are typically performed without consultation and resemble screening.
Patient health benefit was measured in quality-adjusted life years (QALYs), combining survival (life years) during follow-up and the associated health-related quality of life (utility) at each timepoint, using the area under the curve method. Survival was estimated as the number of years patients were alive during the follow-up. The primary outcome was the incremental net monetary benefit (INMB) at a willingness-to-pay (WTP) threshold of £20,000 per QALY [18].
Uncertainty analyses
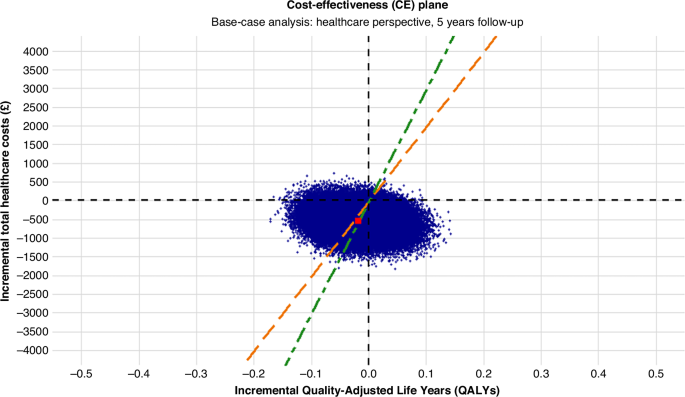
To estimate uncertainty in the cost-effectiveness results, we conducted non-parametric bootstrapping with replacement using the ‘boot’ [19] package in R. For each of the 25 imputed datasets, 5000 bootstrapped samples were drawn with replacement. A Seemingly Unrelated Regression (SUR) model was fitted to each sample using the ‘systemfit’ [20] package, jointly estimating total costs and QALYs across all timepoints while controlling for trial stratification variables (age, type of disease, surgery type, hormone therapy at randomisation and ER status).
Bootstrapped estimates were used to plot the cost-effectiveness plane (CE) plane and cost-effectiveness acceptability curves.
Secondary analyses
Due to the absence of a standard unit cost for surveillance mammography, a sensitivity analysis was conducted using cost estimates from participating trusts. The wide range of reported costs informed the analysis.
A within-trial economic evaluation from a societal perspective was also undertaken, incorporating costs for non-prescribed medication, private and self-funded treatment, travel and parking, incapacity benefit, productivity loss, unpaid informal care and other healthcare-related expenses. These costs were collected via patient questionnaires administered at each surveillance mammogram. Unit costs were derived from national sources or estimated based on participant-reported expenses.
To make the most of available data up to the final timepoint, a 6-year follow-up analysis from a healthcare perspective was conducted, despite incomplete data for some participants recruited later in the trial.
There was a possibility that the outpatient care costs included some of the costs associated with the surveillance mammogram, therefore a sensitivity analysis was conducted excluding outpatient care costs to assess the impact on cost-effectiveness estimates. Subgroup analyses assessed variation in incremental costs and QALYs by stratification variables.
Budget-impact analysis
A pragmatic budget impact analysis was conducted to estimate the NHS savings from implementing reduced-frequency surveillance mammography compared to annual surveillance mammography over a 6-year time horizon (2024–2029), using a simple cost calculator model.
The surveillance population was projected prospectively, accounting for prevalent cases, new diagnoses, survival probabilities and attrition. Savings began from year four post-diagnosis, as patients received annual surveillance for the first 3 years, in line with the main trial. Annual savings were estimated by multiplying annual per-patient cost savings by the number of patients in each surveillance phase per year. The expected number of mammograms saved annually was also estimated. No discounting was applied to costs, in line with the ISPOR Budget Impact Analysis Good Practice guidance [21]. One-way deterministic sensitivity analyses explored uncertainty in attrition rates, survival probabilities, and initial surveillance population, while scenario analyses varied mammogram unit costs.
link


